Tampa Bay Rays vs Philadelphia Phillies
Game Highlights
Scoring summary
| INN | BATTER | PLAY | SCORE |
|---|---|---|---|
| B1 | Bryson Stott | Bryson Stott doubles (35) on a line drive to right fielder Jonny DeLuca. Kyle Schwarber scores. | TB 0, PHI 1 |
| B2 | J.T. Realmuto | J.T. Realmuto doubles (19) on a sharp line drive to left fielder Victor Mesa Jr. Edmundo Sosa scores. | TB 0, PHI 2 |
| B2 | Kyle Schwarber | Kyle Schwarber doubles (20) on a sharp line drive to right fielder Jonny DeLuca. J.T. Realmuto scores. Trea Turner scores. | TB 0, PHI 4 |
| T5 | Jonny DeLuca | Jonny DeLuca homers (10) on a line drive to left center field. | TB 1, PHI 4 |
| B5 | Bryce Harper | Bryce Harper homers (29) on a line drive to right field. | TB 1, PHI 5 |
| B5 | Brandon Marsh | Brandon Marsh out on a sacrifice fly to center fielder Cedric Mullins. Bryson Stott scores. | TB 1, PHI 6 |
| B5 | Edmundo Sosa | Edmundo Sosa homers (9) on a fly ball to right field. | TB 1, PHI 7 |
| T7 | Jonny DeLuca | Jonny DeLuca homers (11) on a fly ball to right center field. | TB 2, PHI 7 |
| T7 | Victor Mesa Jr. | Victor Mesa Jr. singles on a ground ball to second baseman Bryson Stott, deflected by first baseman Alec Bohm. Jorge Mateo scores. | TB 3, PHI 7 |
Box score
| 1 | 2 | 3 | 4 | 5 | 6 | 7 | 8 | 9 | R | |
|---|---|---|---|---|---|---|---|---|---|---|
| TB | 0 | 0 | 0 | 0 | 1 | 0 | 2 | 0 | 0 | 3 |
| PHI | 1 | 3 | 0 | 0 | 3 | 0 | 0 | 0 | 0 | 7 |
Pitching & bullpen
How the game was pitched — the starters, the bullpen sequence and each arm's role, and the pitch counts behind them.
Nick Martinez started for Rays, leaving trailing 0–4. Out of the bullpen, Jesse Scholtens took the roughest line.
-
Nick Martinez
Starter
2.2
50
4
1
L
Pitch-by-pitch: what Nick Martinez threw
CSW 22% 1st-pitch strike 81% 3.1 pitches/PAPitch # % Whiff CS Foul Ball In play Cutter 16 32% 1 2 4 6 3 Sinker 16 32% 2 4 2 1 7 Changeup 10 20% 1 0 2 5 2 Slider 4 8% 0 0 2 1 1 Four-Seam Fastball 4 8% 0 1 0 2 1 - Ian Seymour Middle 0.1 2 0 0 inherited 2, stranded 2
- Jesse Scholtens Long 3.0 50 3 3
- Manuel Rodríguez Middle 1.0 16 0 1
- Casey Legumina Middle 1.0 16 0 0
Zack Wheeler started for Phillies, leaving with a 7–1 lead. Out of the bullpen, Alex McFarlane took the roughest line.
-
Zack Wheeler
Starter
6.0
97
1
5
W
Pitch-by-pitch: what Zack Wheeler threw
CSW 20% 1st-pitch strike 70% 4.2 pitches/PAPitch # % Whiff CS Foul Ball In play Four-Seam Fastball 32 33% 3 4 10 10 5 Splitter 24 25% 4 0 8 7 5 Sinker 13 13% 0 3 5 1 4 Curveball 12 12% 0 3 2 6 1 Cutter 9 9% 0 0 4 3 2 Sweeper 7 7% 2 0 2 2 1 - Alex McFarlane Setup 1.0 22 2 1
- Jesús Luzardo Reliever 1.0 4 0 0
- Jhoan Duran Closer 1.0 13 0 2
Where the game turned
- Stott 2B (1)
Batting lines
| BATTER | AB | R | H | RBI | BB | K | AVG | OBP | SLG | OPS | NOTES |
|---|---|---|---|---|---|---|---|---|---|---|---|
| Victor Mesa Jr. LF | 4 | 0 | 1 | 1 | 0 | 2 | .260 | .327 | .498 | .825 | |
| Ryan Vilade 1B | 2 | 0 | 0 | 0 | 0 | 0 | .245 | .321 | .429 | .750 | |
| Ben Williamson 3B | 2 | 0 | 0 | 0 | 0 | 0 | .238 | .302 | .318 | .620 | |
| Liam Hicks DH | 4 | 0 | 2 | 0 | 0 | 0 | .284 | .367 | .434 | .801 | 2 2B |
| Richie Palacios 2B | 4 | 0 | 0 | 0 | 0 | 0 | .235 | .330 | .374 | .704 | |
| Jonny DeLuca RF | 4 | 2 | 2 | 2 | 0 | 0 | .266 | .300 | .429 | .729 | 2 HR (10, 11) |
| Cedric Mullins CF | 4 | 0 | 1 | 0 | 0 | 2 | .205 | .284 | .344 | .628 | |
| Nick Fortes C | 4 | 0 | 0 | 0 | 0 | 2 | .258 | .304 | .376 | .680 | |
| Jorge Mateo SS | 3 | 1 | 1 | 0 | 0 | 0 | .203 | .245 | .314 | .559 | 2B |
| Jonathan Aranda 1B | 2 | 0 | 1 | 0 | 0 | 1 | .274 | .358 | .434 | .792 | 2B |
| Junior Caminero 3B | 2 | 0 | 0 | 0 | 0 | 1 | .276 | .360 | .524 | .884 |
| BATTER | AB | R | H | RBI | BB | K | AVG | OBP | SLG | OPS | NOTES |
|---|---|---|---|---|---|---|---|---|---|---|---|
| Trea Turner SS | 5 | 1 | 2 | 0 | 0 | 1 | .242 | .297 | .378 | .675 | |
| Kyle Schwarber DH | 4 | 1 | 2 | 2 | 1 | 1 | .232 | .354 | .503 | .857 | 2B |
| Bryson Stott 2B | 3 | 1 | 3 | 1 | 1 | 0 | .256 | .334 | .401 | .735 | 2 2B, SB |
| Alec Bohm 1B | 2 | 0 | 0 | 0 | 2 | 0 | .249 | .315 | .383 | .698 | |
| Brandon Marsh LF | 2 | 0 | 0 | 1 | 0 | 0 | .260 | .304 | .408 | .712 | |
| Edmundo Sosa 3B | 4 | 2 | 2 | 1 | 0 | 1 | .247 | .283 | .429 | .712 | HR (9), 2B |
| Justin Crawford CF | 4 | 0 | 1 | 0 | 0 | 0 | .264 | .309 | .353 | .662 | |
| J.T. Realmuto C | 4 | 1 | 1 | 1 | 0 | 1 | .205 | .283 | .331 | .614 | 2B |
| Bryce Harper RF | 5 | 1 | 1 | 1 | 0 | 1 | .269 | .380 | .485 | .865 | HR (29) |
Pitching lines
| PITCHER | IP | H | R | ER | BB | K | HR | NP | ERA | DEC |
|---|---|---|---|---|---|---|---|---|---|---|
| Nick Martinez | 2.2 | 7 | 4 | 4 | 1 | 1 | 0 | 50 | 3.10 | L |
| Ian Seymour | 0.1 | 0 | 0 | 0 | 0 | 0 | 0 | 2 | 4.21 | |
| Jesse Scholtens | 3.0 | 3 | 3 | 3 | 1 | 3 | 2 | 50 | 4.34 | |
| Manuel Rodríguez | 1.0 | 0 | 0 | 0 | 2 | 1 | 0 | 16 | 2.70 | |
| Casey Legumina | 1.0 | 2 | 0 | 0 | 0 | 0 | 0 | 16 | 3.77 |
| PITCHER | IP | H | R | ER | BB | K | HR | NP | ERA | DEC |
|---|---|---|---|---|---|---|---|---|---|---|
| Zack Wheeler | 6.0 | 5 | 1 | 1 | 0 | 5 | 1 | 97 | 3.00 | W |
| Alex McFarlane | 1.0 | 3 | 2 | 2 | 0 | 1 | 1 | 22 | 2.84 | |
| Jesús Luzardo | 1.0 | 0 | 0 | 0 | 0 | 0 | 0 | 4 | 2.86 | |
| Jhoan Duran | 1.0 | 0 | 0 | 0 | 0 | 2 | 0 | 13 | 1.82 |
Manager comparison

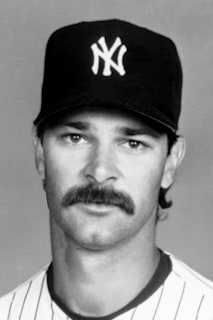
Keep reading
How RunsLeft analyzes games
Standard content on this page comes from the MLB Stats API. The pitching analysis describes how the game was pitched — the starter's line, the bullpen sequence and each arm's role (opener, bulk, setup, closer), pitch counts as a fatigue signal, and the leverage context where the game turned. Reliever roles are inferred from how the manager used each arm up to that date. It describes structure and constraints; it does not grade the manager.