Tampa Bay Rays at Philadelphia Phillies
Lineups
Lineups are usually announced ~90 minutes before first pitch. Check back soon.
Hitter season stats
Season-to-date lines for each hitter in the projected lineup, with a Marcel projection (Proj OPS). Season columns are 2026 to date; Proj is a forward-looking estimate, not a result.
| BATTER | 2026 SEASON | PROJ OPS | ||||||
|---|---|---|---|---|---|---|---|---|
| AVG | OBP | SLG | OPS | HR | RBI | K | ||
| 1 Yandy Díaz DH · R | .292 | .358 | .449 | .807 | 22 | 81 | 96 | .745 |
| 2 Junior Caminero 3B · R | .277 | .363 | .529 | .892 | 41 | 97 | 125 | .767 |
| 3 Jonathan Aranda 1B · L | .277 | .360 | .440 | .800 | 22 | 92 | 154 | .743 |
| 4 Chandler Simpson LF · L | .309 | .337 | .360 | .697 | 0 | 38 | 46 | .731 |
| 5 Liam Hicks C · L | .288 | .371 | .440 | .811 | 18 | 81 | 52 | .726 |
| 6 Cedric Mullins CF · L | .202 | .283 | .340 | .623 | 14 | 45 | 93 | .711 |
| 7 Taylor Walls SS · S | .216 | .304 | .289 | .593 | 2 | 35 | 101 | .694 |
| 8 Richie Palacios 2B · L | .234 | .330 | .377 | .707 | 10 | 53 | 65 | .720 |
| 9 Jonny DeLuca RF · R | .259 | .290 | .410 | .700 | 9 | 46 | 70 | .717 |
| BATTER | 2026 SEASON | PROJ OPS | ||||||
|---|---|---|---|---|---|---|---|---|
| AVG | OBP | SLG | OPS | HR | RBI | K | ||
| 1 Trea Turner SS · R | .241 | .299 | .382 | .681 | 19 | 58 | 142 | .738 |
| 2 Luis Arraez 2B · L | .313 | .348 | .424 | .772 | 6 | 64 | 28 | .734 |
| 3 Kyle Schwarber DH · L | .234 | .355 | .512 | .867 | 45 | 95 | 216 | .764 |
| 4 Bryce Harper 1B · L | .271 | .382 | .491 | .873 | 28 | 85 | 144 | .759 |
| 5 Alec Bohm 3B · R | .253 | .317 | .390 | .707 | 15 | 87 | 85 | .730 |
| 6 Bryson Stott 2B · L | .248 | .324 | .387 | .711 | 10 | 65 | 99 | .722 |
| 7 Brandon Marsh LF · L | .260 | .304 | .405 | .709 | 17 | 58 | 138 | .741 |
| 8 Justin Crawford CF · L | .265 | .312 | .358 | .670 | 3 | 41 | 78 | .750 |
| 9 J.T. Realmuto C · R | .213 | .289 | .342 | .631 | 11 | 49 | 96 | .710 |
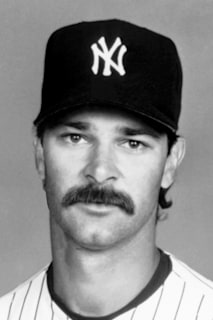
Manager comparison

Bullpen availability
- Available 9
- Limited 1
- Rest required 0
- Inactive 0
- Available 5
- Limited 4
- Rest required 0
- Inactive 1
Recent form
Pitching & bullpen preview
Probable starters and each bullpen's availability load in the sections above — the Rays and Phillies staffs going in.
Once the game ends, a full pitching and bullpen breakdown appears here: starter lines, the relief sequence and each arm's role, pitch counts, and where the game turned.
Keep reading
How RunsLeft analyzes games
Standard content on this page comes from the MLB Stats API. The pitching analysis describes how the game was pitched — the starter's line, the bullpen sequence and each arm's role (opener, bulk, setup, closer), pitch counts as a fatigue signal, and the leverage context where the game turned. Reliever roles are inferred from how the manager used each arm up to that date. It describes structure and constraints; it does not grade the manager.