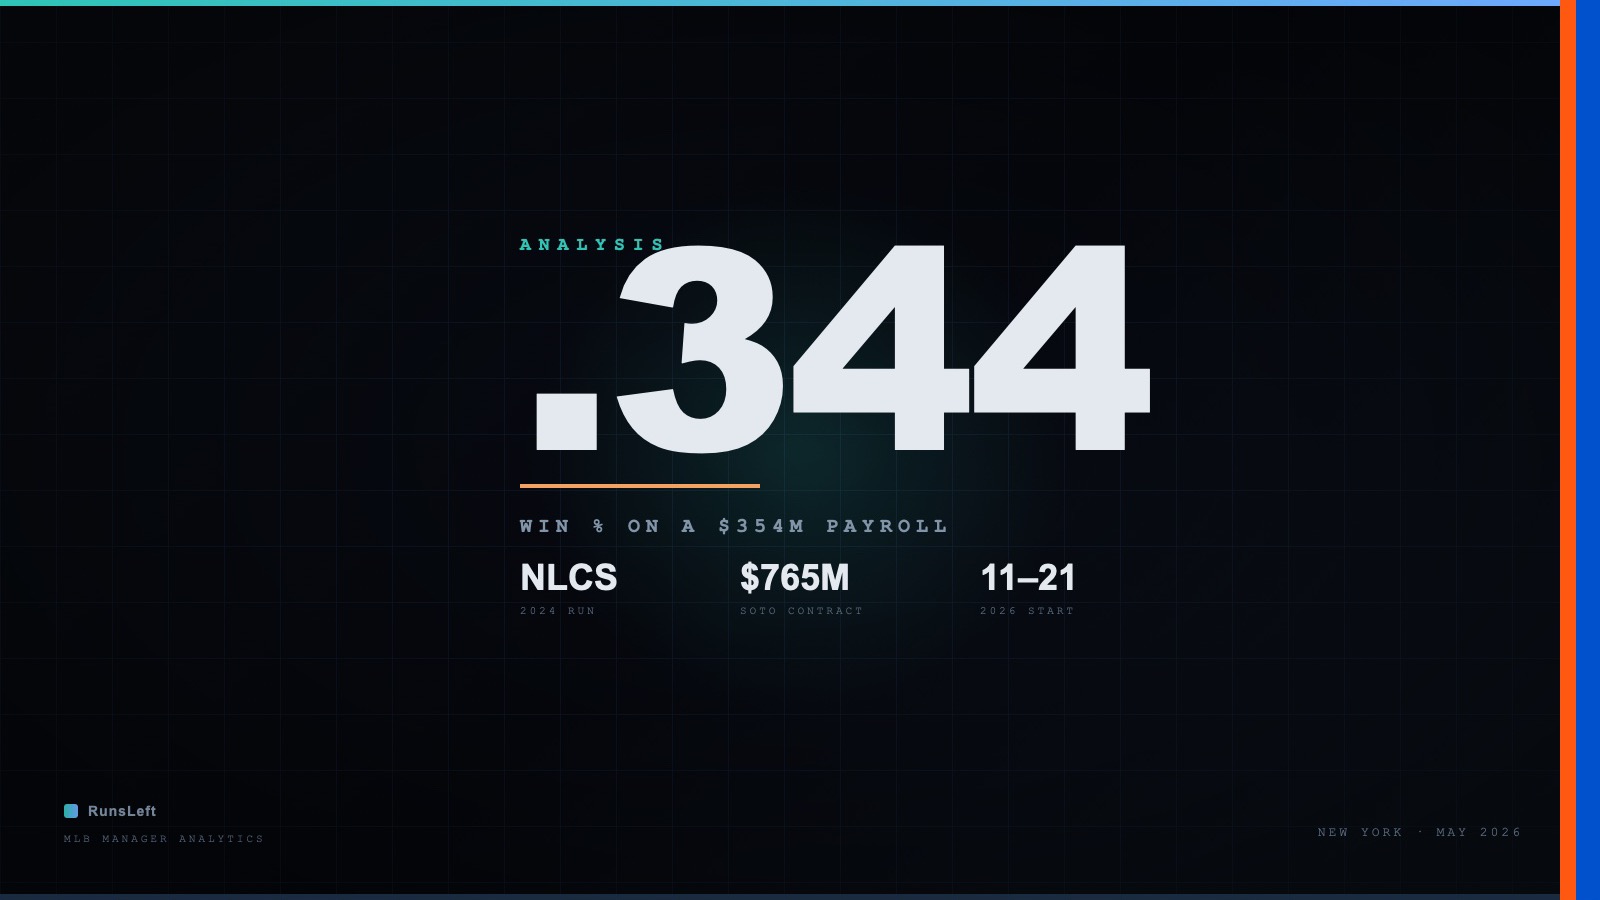
The 2026 New York Mets carry the largest payroll in baseball ($354.7M), the richest contract in the history of professional sports (Juan Soto, $765M), and an 11–21 record — one of the worst openings in franchise history. Sixteen months ago, Carlos Mendoza guided the same franchise through one of its most improbable playoff runs. Unlike Philadelphia and Boston, where similar collapses produced firings, President of Baseball Operations David Stearns has publicly retained Mendoza, stating the organization does not view this as a "manager problem." The harder question is who actually built the roster that just collapsed.
This is our analytical verdict.
Mendoza delivered the franchise's most improbable postseason run in a decade, earning serious Manager of the Year consideration in year one. His Pythagorean record shows modest overperformance in 2024 and underperformance in close games during the 2025 collapse — a mixed tactical signal. His bullpen management, despite loud criticism, is not statistically anomalous. His player-development work (Alvarez, Baty, Soto) reflects organizational competence. His acknowledged communication shortfalls in 2025 are a legitimate growth area but not a primary cause of the collapse. The 2026 struggles are occurring with a demonstrably broken roster — a decimated rotation, multiple injured or struggling position acquisitions, and a historically expensive payroll — that would challenge any manager in baseball.
Stearns' 2024 roster construction — built on value trades (Torrens, Maton, Taylor, Brazoban) and targeted free agent additions — was analytically excellent and produced an NLCS run that exceeded all reasonable expectations. The Juan Soto signing has been validated on year-one production (6.2 WAR), but the $765M, 15-year structure represents an aging-curve commitment Stearns' Milwaukee philosophy was explicitly designed to avoid. His international pipeline (three top-50 in 2024, #2 overall in 2025) is franchise-level work. However, the 2026 roster construction concentrates correlated injury and performance risk — Robert Jr., Polanco, Montas — that has materialized catastrophically, while the Nimmo/Semien trade has delivered negative value. The Bichette and Polanco contracts represent precisely the type of aging, injury-prone investment Stearns built his reputation by avoiding.
The Bottom Line
Carlos Mendoza was not fired — Stearns publicly declined to make him the institutional answer for the team's collapse. The data supports that restraint. Mendoza's 2024 NLCS run is the most impressive managerial achievement in this series, and his 2026 struggles are occurring with a roster whose failures he had no authority to prevent. Stearns built that roster, signed the contracts, made the trades, and retains the philosophical discretion that produced both the 2024 success and the 2026 fragility. The accountability for a $354 million team playing .344 baseball belongs primarily to the architect.
The full case follows.
Part I: Carlos Mendoza — The Manager's Record
The Historical Achievement
Carlos Mendoza was appointed Mets manager on November 13, 2023 — no managerial experience at any professional level. His predecessor's résumé, and the weight of managing the highest payroll in baseball in the media capital of the world, would have crushed many debut managers. Instead, Mendoza became the first rookie manager in New York Mets history to guide the team to the playoffs, engineering one of the sport's most celebrated mid-season turnarounds. His overall record through May 1, 2026, stands at 183–173 (.514), and his tenure has been defined by performance extremes — both historic — that make any flat assessment of his record misleading without context.
Win Percentage and Pythagorean Analysis
The Pythagorean win expectation — derived from runs scored and runs allowed — provides critical context for evaluating whether a team's record reflects genuine performance or variance in close games. For Mendoza, the analysis reveals a meaningful shift: modest overperformance in his triumphant first season, followed by consistent underperformance relative to run differential as the team's fortunes declined.
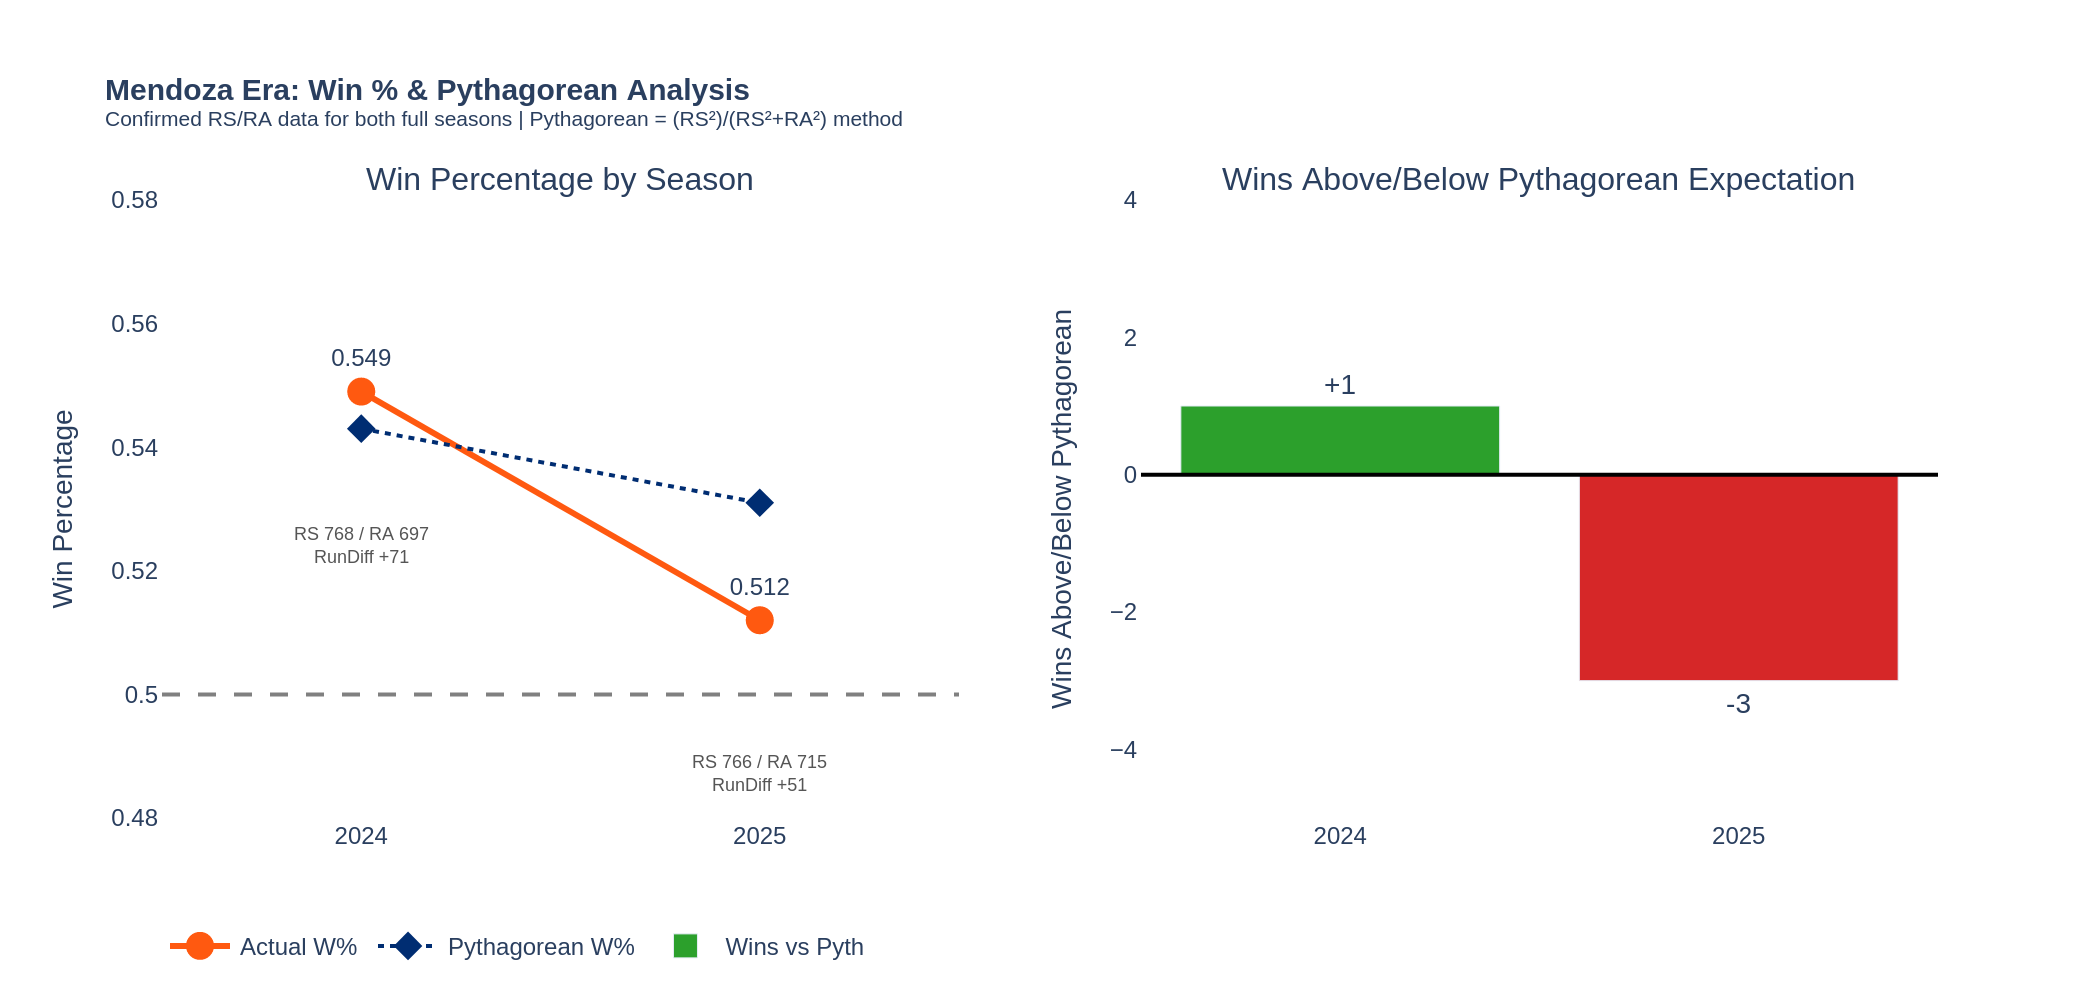
| Season | W | L | W% | RS | RA | Run Diff | Pyth W | Pyth L | +/– Pyth | Result |
|---|---|---|---|---|---|---|---|---|---|---|
| 2024 | 89 | 73 | .549 | 768 | 697 | +71 | 88 | 74 | +1 | NLCS |
| 2025 | 83 | 79 | .512 | 766 | 715 | +51 | 86 | 76 | –3 | Missed playoffs |
| 2026† | 11 | 21 | .344 | 110 | 144 | –34 | 12 | 20 | –1 | Last, NL East |
Table 1 — Mendoza's season-by-season record with Pythagorean comparison. †2026 through May 1 (32 games). Pythagorean W calculated as RS²/(RS²+RA²) × 162.
The 2024 season's single-win Pythagorean overperformance confirms the obvious: the Mets' success was earned, not lucky. Their +71 run differential genuinely projected 88 wins; they delivered 89. The 2025 underperformance (–3 vs. a Pythagorean of 86) is analytically significant: a team that outscored opponents by 51 runs across 162 games should have won 86. Losing three more games than that projection suggests the Mets were disproportionately ineffective in close contests during their historic late-season collapse. The 2026 picture is starker — a –34 run differential through 32 games indicates a team genuinely performing poorly, not merely unlucky in close games.
The 2024 Miracle: Context for the Record
No analysis of Mendoza's tenure is complete without understanding the magnitude of the 2024 turnaround. The Mets started 0–5, then continued to struggle, reaching their nadir on May 29 at 22–33 — 11 games below .500. A team meeting led by shortstop Francisco Lindor is widely credited with resetting the clubhouse's competitive DNA. What followed was one of the most extraordinary sustained runs in franchise history: 67–40 (.626) over the final 107 games. The Mets finished at 89–73, made the postseason, eliminated the Brewers, upset the Phillies in the NLDS, and carried the defending NL champion to six games in the NLCS. For this achievement, Mendoza received serious NL Manager of the Year consideration, finishing third in voting.
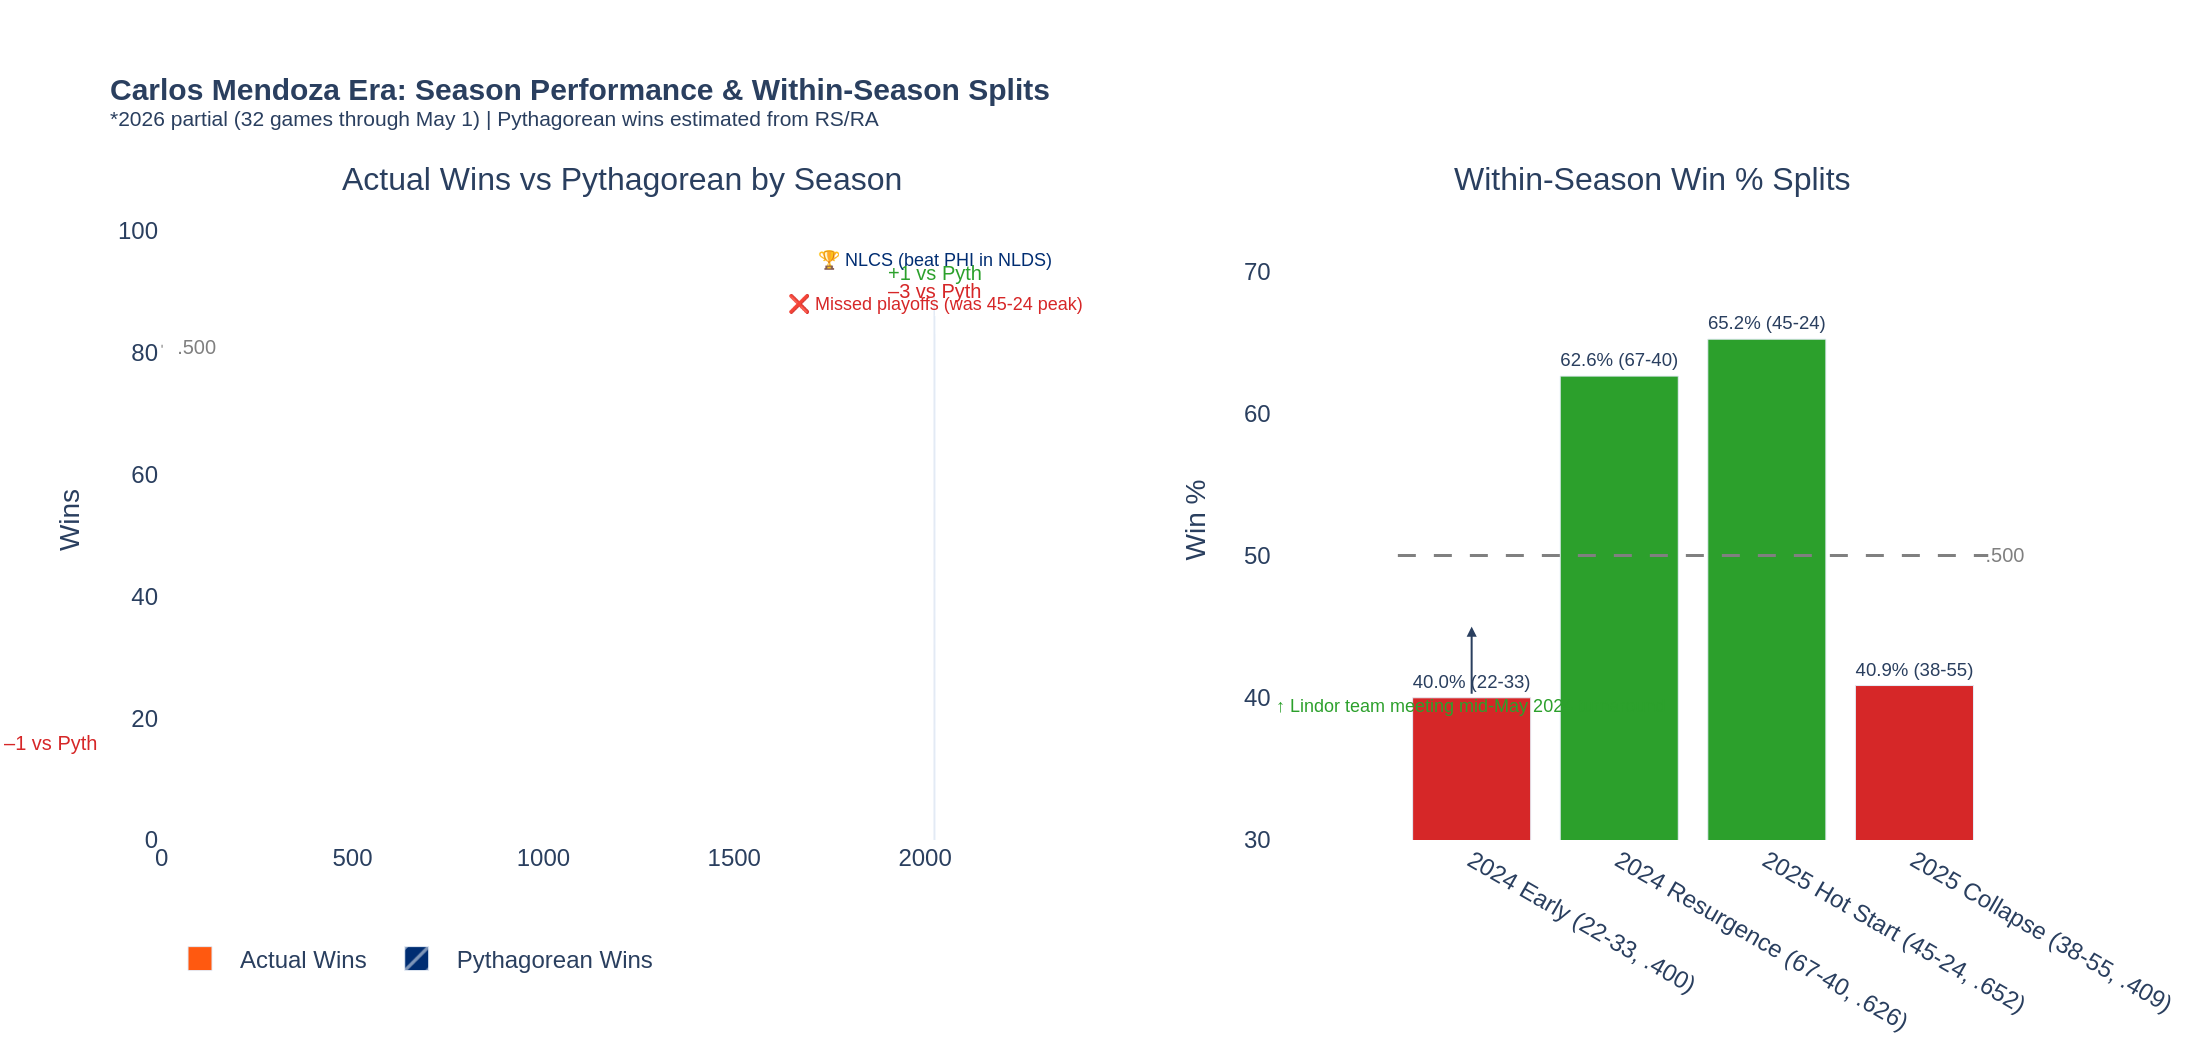
| Stretch | Record | Win% | Context |
|---|---|---|---|
| 2024 Early (Games 1–55) | 22–33 | .400 | Started 0-5; bottomed May 29 at 11.5 below .500 |
| 2024 Resurgence (Games 56–162) | 67–40 | .626 | Post-Lindor meeting; league-best pace; NLCS run |
| 2025 Hot Start (Games 1–69) | 45–24 | .652 | Best record in MLB; 2nd-best start in franchise history; 96.2% playoff probability |
| 2025 Collapse (Games 70–162) | 38–55 | .409 | Three 7+ game losing streaks; 0-70 when trailing after 8th; eliminated Sept 28 |
Table 2 — Within-season performance splits. The amplitude between the Mets' best and worst stretches under Mendoza is historically unusual — both in positive and negative directions.
The 2025 Collapse: Understanding the Futility
The 2025 season's second half represents one of the most dramatic performance reversals in the Wild Card era. After standing at 45–24 with a 96.2% playoff probability — the best record in Major League Baseball — the Mets went 38–55 for the remainder of the season, missing the postseason by a single game. The collapse featured three separate losing streaks of seven or more games and a statistical marker that encapsulates the team's futility: 0-for-70 when trailing after the eighth inning — the only team in baseball with that stat.
Two questions must be separated analytically: how much of this collapse was roster-driven, and how much was manager-driven? The 0-70 futility marker points to a bullpen that could not hold late leads and an offense that could not mount comebacks — both primarily personnel questions. The –3 Pythagorean gap indicates genuine underperformance in close games, which does implicate in-game management to some degree. But no manager in baseball history has manufactured comebacks without the personnel to execute them. The 2025 collapse requires a roster accountability verdict alongside the managerial one.
The 2025 Collapse in Numbers. Peak playoff probability: 96.2% (at 45–24) · Final record: 83–79 · Late-season pace: 38–55 (.409) · Games above .500 surrendered: –17 · Only the 3rd team in the Wild Card era to miss the playoffs after starting 45–24 or better · Late-game futility: 0-70 when trailing after 8th inning (only MLB team with this stat).
Player Performance Under Mendoza
A manager's impact on individual player development and performance is among the clearest signals of their quality. Under Mendoza, the evidence is genuinely mixed — strong in the young-player development domain, more complex for the veteran core.
Juan Soto — Maximizing a $765M Investment
Soto's 2025 debut with the Mets — 6.2 WAR, NL on-base percentage leader, third in MVP voting — represents the franchise's clearest proof that at least one element of Stearns' high-stakes roster construction is working. Mendoza's role in deploying a player of Soto's caliber is largely managerial support: protecting him in the lineup, respecting his preparation process, and ensuring his environment facilitates elite performance. Through early 2026, with the team struggling around him, Soto's 0.9 WAR in approximately one month of play confirms he remains the franchise anchor amid a wider collapse.
Francisco Alvarez and Brett Baty — The Young Core
Perhaps the most defensible evidence of Mendoza's developmental skill is his handling of Francisco Alvarez and Brett Baty. When Alvarez struggled early in 2025, Mendoza's staff managed his demotion to Triple-A with a stated developmental intent — not as a punitive measure but as a reset to correct mechanical issues. His return produced improved plate discipline and defensive confidence. For 2026, the organization invested in his future by hiring former catcher J.P. Arencibia as a dedicated catching coach. Baty, given consistent starts across second and third base, has received the kind of multi-season patience that developing players require but rarely receive in New York. Both are progressing above their pre-Mendoza trajectories.
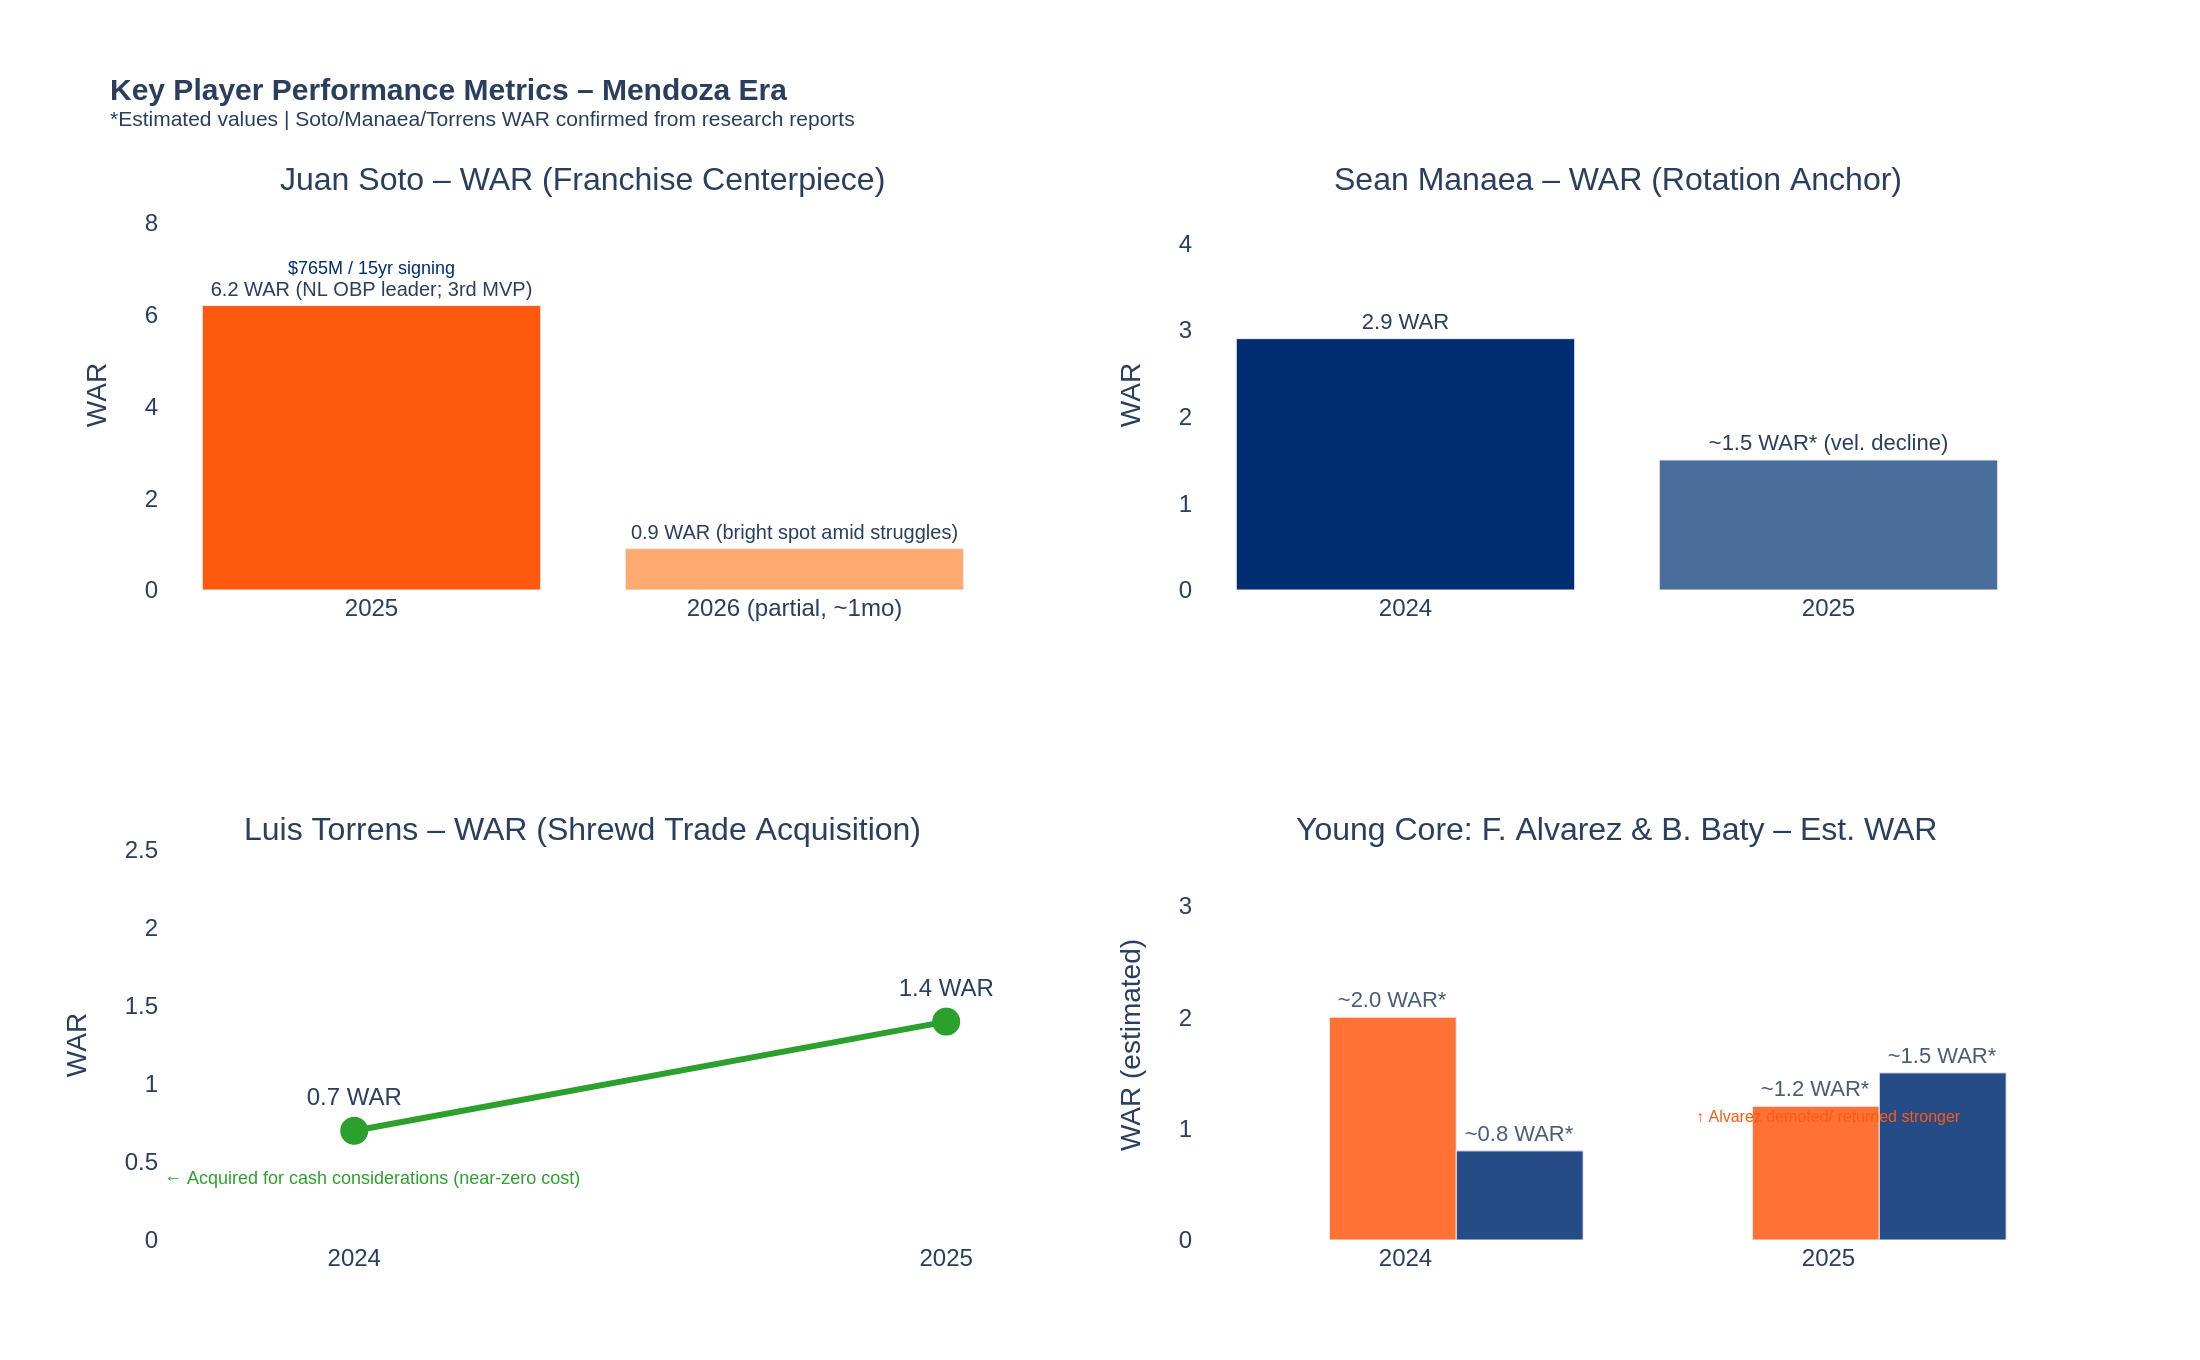
| Player | Season | WAR | Achievement / Development Context |
|---|---|---|---|
| Juan Soto | 2025 | 6.2 | NL OBP leader; 3rd NL MVP; immediate franchise centerpiece |
| Juan Soto | 2026† | 0.9 | Bright spot; team's best performer amid 11-21 start |
| Sean Manaea | 2024 | 2.9 | Solid rotation anchor; mid-rotation value |
| Sean Manaea | 2025 | ~1.5* | Velocity decline; diminished effectiveness |
| Luis Torrens | 2024 | 0.7 | Gold Glove finalist; acquired for cash (near-zero cost) |
| Luis Torrens | 2025 | 1.4 | Continued improvement; exceptional ROI |
| Francisco Alvarez | 2024 | ~2.0* | Strong rookie; key development milestone |
| Francisco Alvarez | 2025 | ~1.2* | Brief demotion → return with improved approach; J.P. Arencibia hired as coach |
| Brett Baty | 2025 | ~1.5* | "Long leash"; 2B/3B versatility; growing contributions |
Table 3 — Key player performance metrics under Mendoza. *Estimated WAR values based on qualitative report descriptions. †2026 partial season.
Bullpen Management: The Ottavino Controversy
No aspect of Mendoza's tenure attracted more pointed criticism than his management of relievers. Former Mets reliever Adam Ottavino delivered the sharpest public indictment, stating Mendoza "has no idea what he's doing when it comes to bullpen guys," citing a 2025 epidemic of elbow surgeries and what he characterized as "haphazard" usage. The criticism pointed specifically to A.J. Minter's workload following hip surgery, and the rapid innings accumulation of Dedniel Núñez and Max Kranick before their IL stints. The same usage patterns shape tonight's Mets edges, where reliever leverage and pitcher pull timing both move the model.
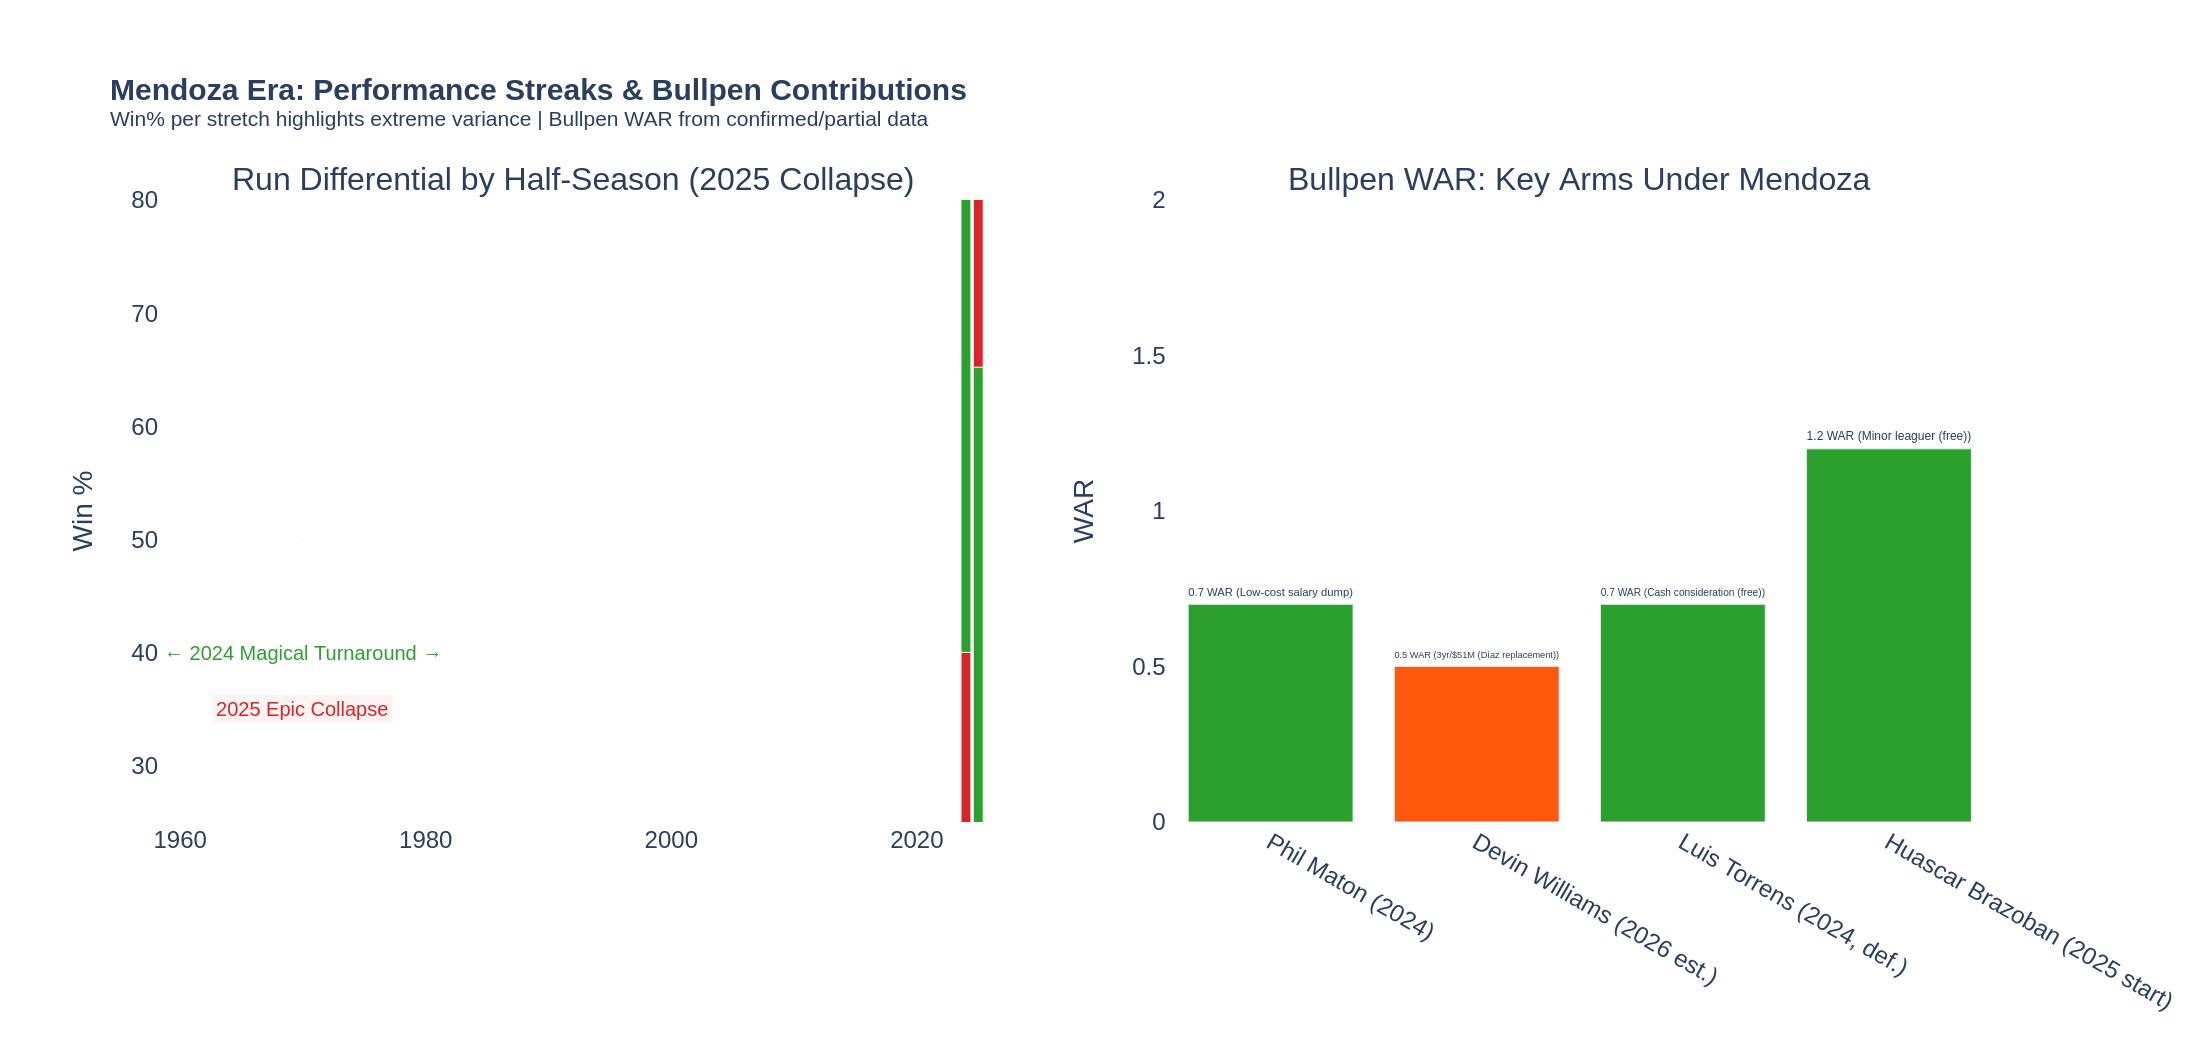
The statistical data, however, does not support Ottavino's characterization. A review of Mets bullpen usage metrics over 2024–2025 found their patterns — appearances on consecutive days, total innings per reliever — were in line with league averages. Mendoza's own bench coach, John Gibbons, directly refuted the criticism: "He did a tremendous job trying to protect those guys — often held them back even when it left us short-handed." A specific early-2026 incident underscores Mendoza's stated philosophy: he deliberately declined to use elite relievers Devin Williams and Brooks Raley on back-to-back days in March, sacrificing a potential series sweep to preserve their health for the long season ahead. This is the behavior of a manager with a deliberate, long-game workload philosophy — not one acting haphazardly.
"He did a tremendous job trying to protect those guys. He often held relievers back even when it left the team short-handed in a particular game." — John Gibbons, Bench Coach, directly refuting Ottavino's criticism
The most honest assessment is that the 2025 pitcher injury epidemic reflected a combination of factors: organizational protocols around player returns from rehab, the natural attrition of a heavily used bullpen, and some communication lapses that Mendoza himself acknowledged. The data does not establish Mendoza as statistically outlying in his reliever usage; the narrative that he single-handedly caused the injury wave is not supported by the evidence.
Clubhouse Culture and Mendoza's Self-Assessment
Mendoza has consistently identified communication as the core of his managerial philosophy — and he has been unusually candid in acknowledging where he fell short. Reflecting on the 2025 collapse, he stated directly that he "fell short" in communicating at an elite level and committed to more proactive issue resolution in 2026. He addressed rumors of clubhouse dysfunction directly: "I'm going to call that BS" — while also conceding the team may have lacked a "celebratory culture" conducive to building momentum during the second half. The ping-pong table that was replaced by a chessboard and cribbage table reflects a subtle, deliberate change in clubhouse atmosphere — small signals, but conscious ones.
Through all the turbulence, the front office's message has been unequivocal:
"I very much believe in him. The widespread issues we're seeing are not viewed as a singular manager problem." — David Stearns, President of Baseball Operations, May 1, 2026
That statement — coming after an 11–21 start — is either a remarkable expression of principled organizational continuity, or evidence that Stearns recognizes the team's struggles have roots in the roster he constructed. The data suggests it is predominantly the latter.
Part II: David Stearns — The Architect's Record
The Strategic Mandate and Milwaukee Context
David Stearns arrived at Citi Field on October 2, 2023, under a five-year contract worth approximately $10 million annually, making him the first President of Baseball Operations in Mets franchise history. He brought an extraordinary credential: in Milwaukee, he had transformed a small-market franchise into four consecutive playoff appearances (2018–2021) using analytics-driven roster construction, development-first thinking, and astute trade market activity. In New York, he would have owner Steve Cohen's financial firepower behind the same analytical toolkit — a combination that should, in theory, be unstoppable.
His stated philosophy upon arrival was "low-risk, high-flexibility" roster construction — avoiding the long-term contracts that had crippled previous Mets regimes — supplemented by willingness to deploy Cohen's resources for genuinely irreplaceable opportunities. The 2024 season validated this strategy entirely. The 2025 and 2026 campaigns have complicated the narrative considerably.
Trade Ledger Analysis
Stearns' best transactions have been exercises in value extraction from overlooked markets — low-cost acquisitions that delivered substantial MLB production. His most striking example is the acquisition of Luis Torrens from Seattle for cash considerations: effectively zero cost for a player who delivered 0.7 WAR in 2024 (as a Gold Glove finalist) and 1.4 WAR in 2025. The cumulative 2.1 WAR from a near-zero investment represents extraordinary surplus value by any standard. Similarly, the Phil Maton acquisition (salary dump from Tampa Bay) delivered 0.7 WAR, and Huascar Brazoban (acquired for a low-level minor leaguer) produced at an exceptional rate during 2025. These moves reflect the analytical edge that made Stearns' Milwaukee tenure celebrated.
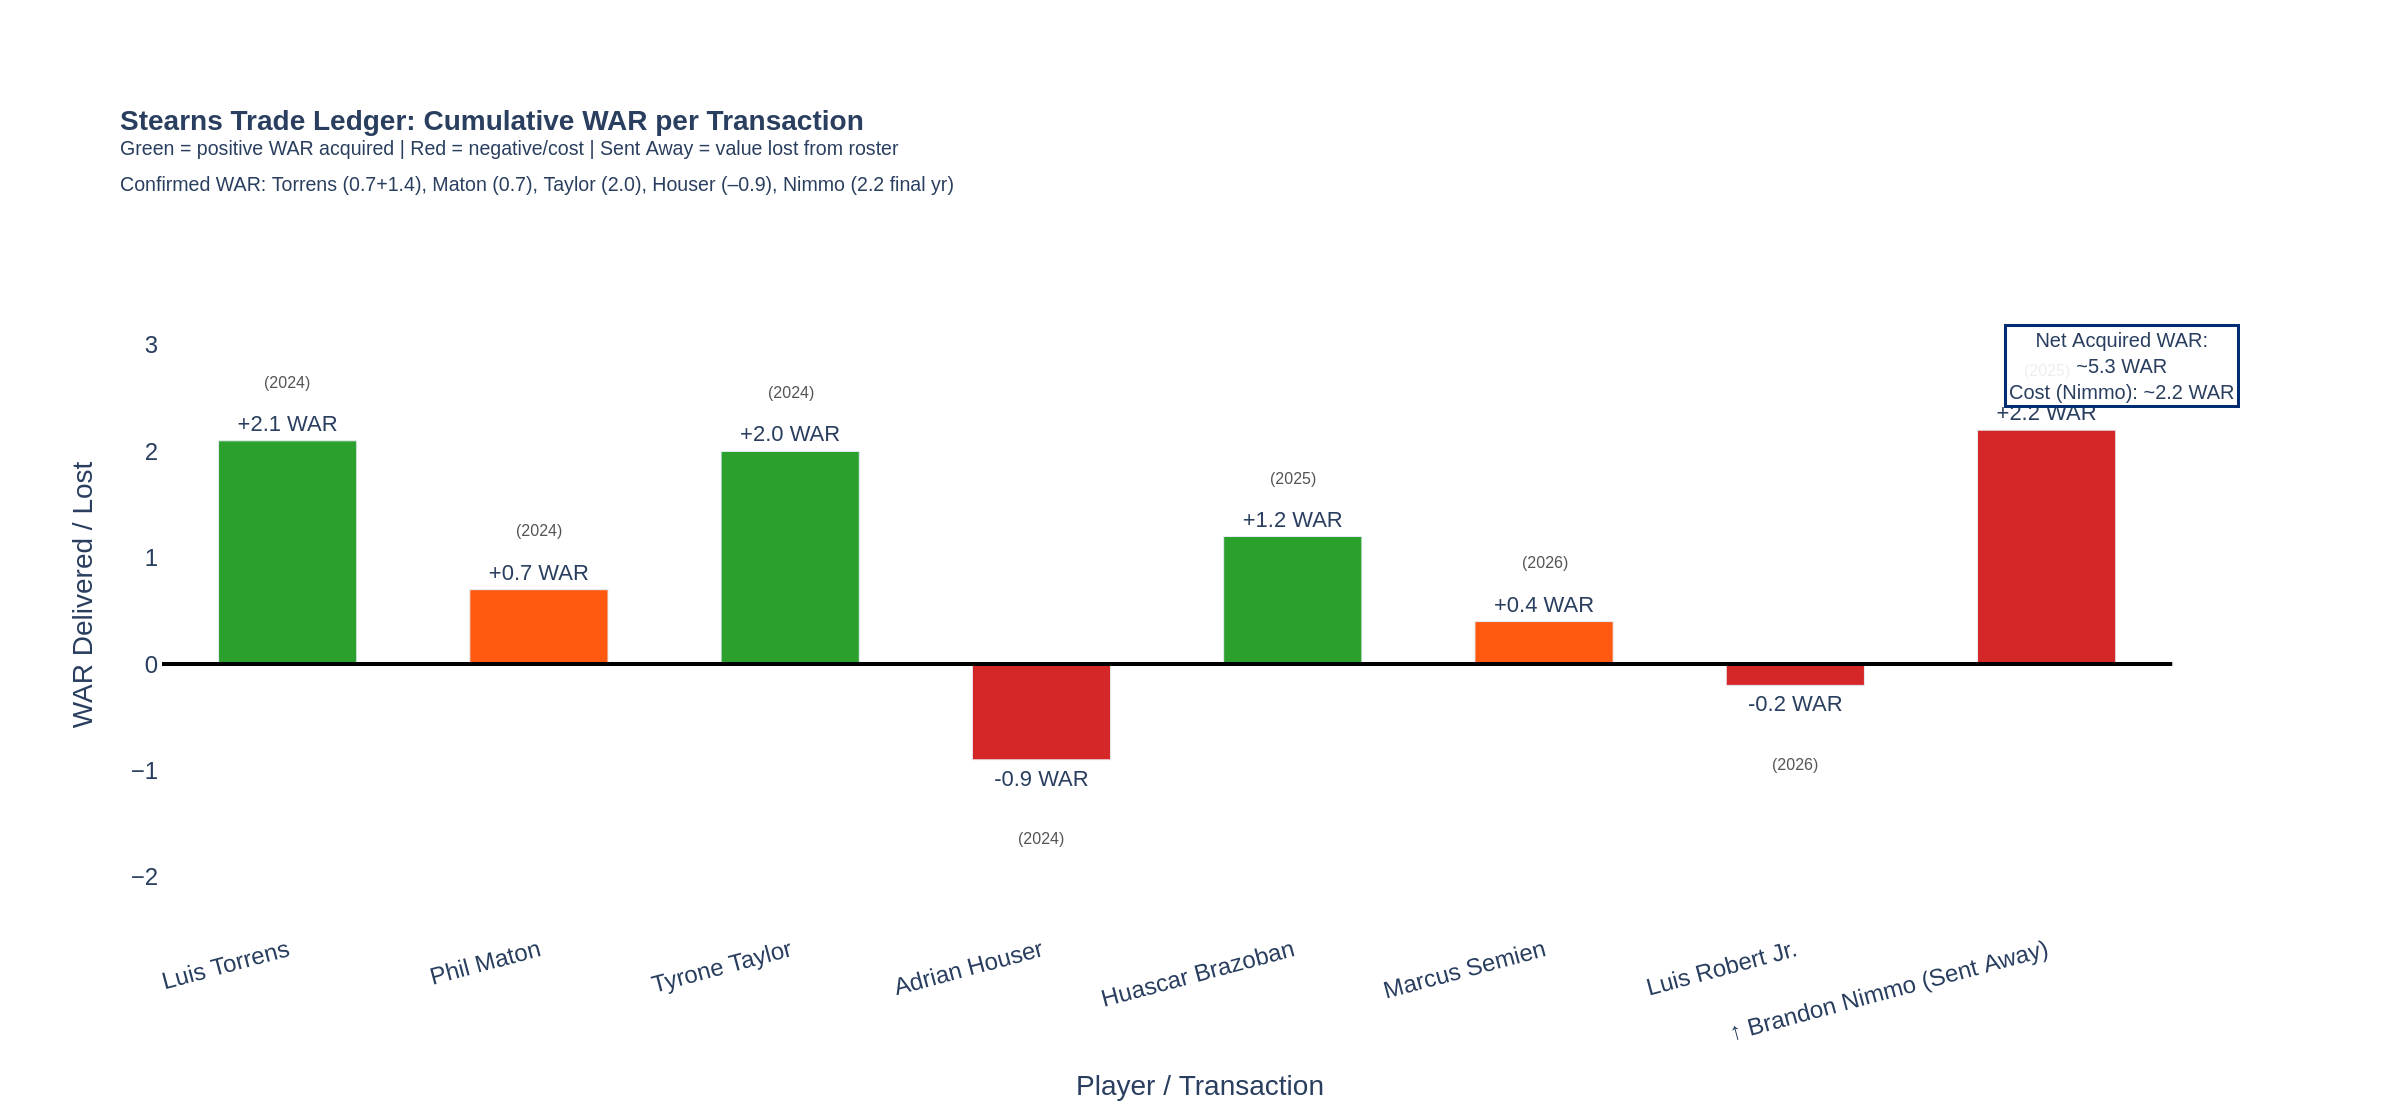
| Player | Direction | From/To | Year | Cost / Return | WAR | Assessment |
|---|---|---|---|---|---|---|
| Luis Torrens | Acquired | SEA Mariners | 2024 | Cash (near-zero) | 2.1 | Exceptional — Gold Glove finalist |
| Phil Maton | Acquired | TB Rays | 2024 | Salary dump (near-zero) | 0.7 | Outstanding surplus value |
| Tyrone Taylor | Acquired | MIL Brewers | 2024 | Prospect Coleman Crow | 2.0 | Clear win; Crow dealt with injuries |
| Adrian Houser | Acquired | MIL Brewers | 2024 | Same as Taylor trade | –0.9 | Struggled badly; offset by Taylor |
| Huascar Brazoban | Acquired | — | 2025 | Low-level minor leaguer | ~1.2 | "Steal" — magnificent 2025 start |
| Marcus Semien | Acquired | TEX Rangers | Post-2025 | Brandon Nimmo | 0.4 (partial) | Net negative vs. Nimmo's ~2.2 WAR value |
| Luis Robert Jr. | Acquired | — | 2026 | Significant cost | –0.2 | Lumbar disc herniation; sidelined indefinitely |
| Brandon Nimmo | Sent away | TEX Rangers | Post-2025 | Semien + return | 2.2 (final Mets yr) | Semien return disappointing early |
Table 4 — Stearns trade ledger with WAR values. Net positive trades: Torrens, Maton, Taylor, Brazoban. Net negative: Robert Jr., Houser. Mixed/early-stage: Semien/Nimmo swap.
The aggregate trade balance is modestly positive — approximately +3.1 WAR net (acquired minus sent away) — but the distribution is concerning. Stearns' best trades are asymmetric successes at minimal cost; his worst are costly failures in high-profile moves. The Luis Robert Jr. gamble is the most glaring example: a player with an extensive injury history, acquired at significant cost before 2026, who immediately suffered a lumbar disc herniation and was sidelined indefinitely. This is not purely bad luck — it was identifiable risk that the front office consciously accepted and that Stearns' philosophy of "high-risk, high-reward" explicitly anticipates. The problem is that multiple such risks — Robert Jr., Polanco, Montas — materialized simultaneously, leaving the 2026 roster hollowed out from multiple angles.
Free Agent Signing ROI
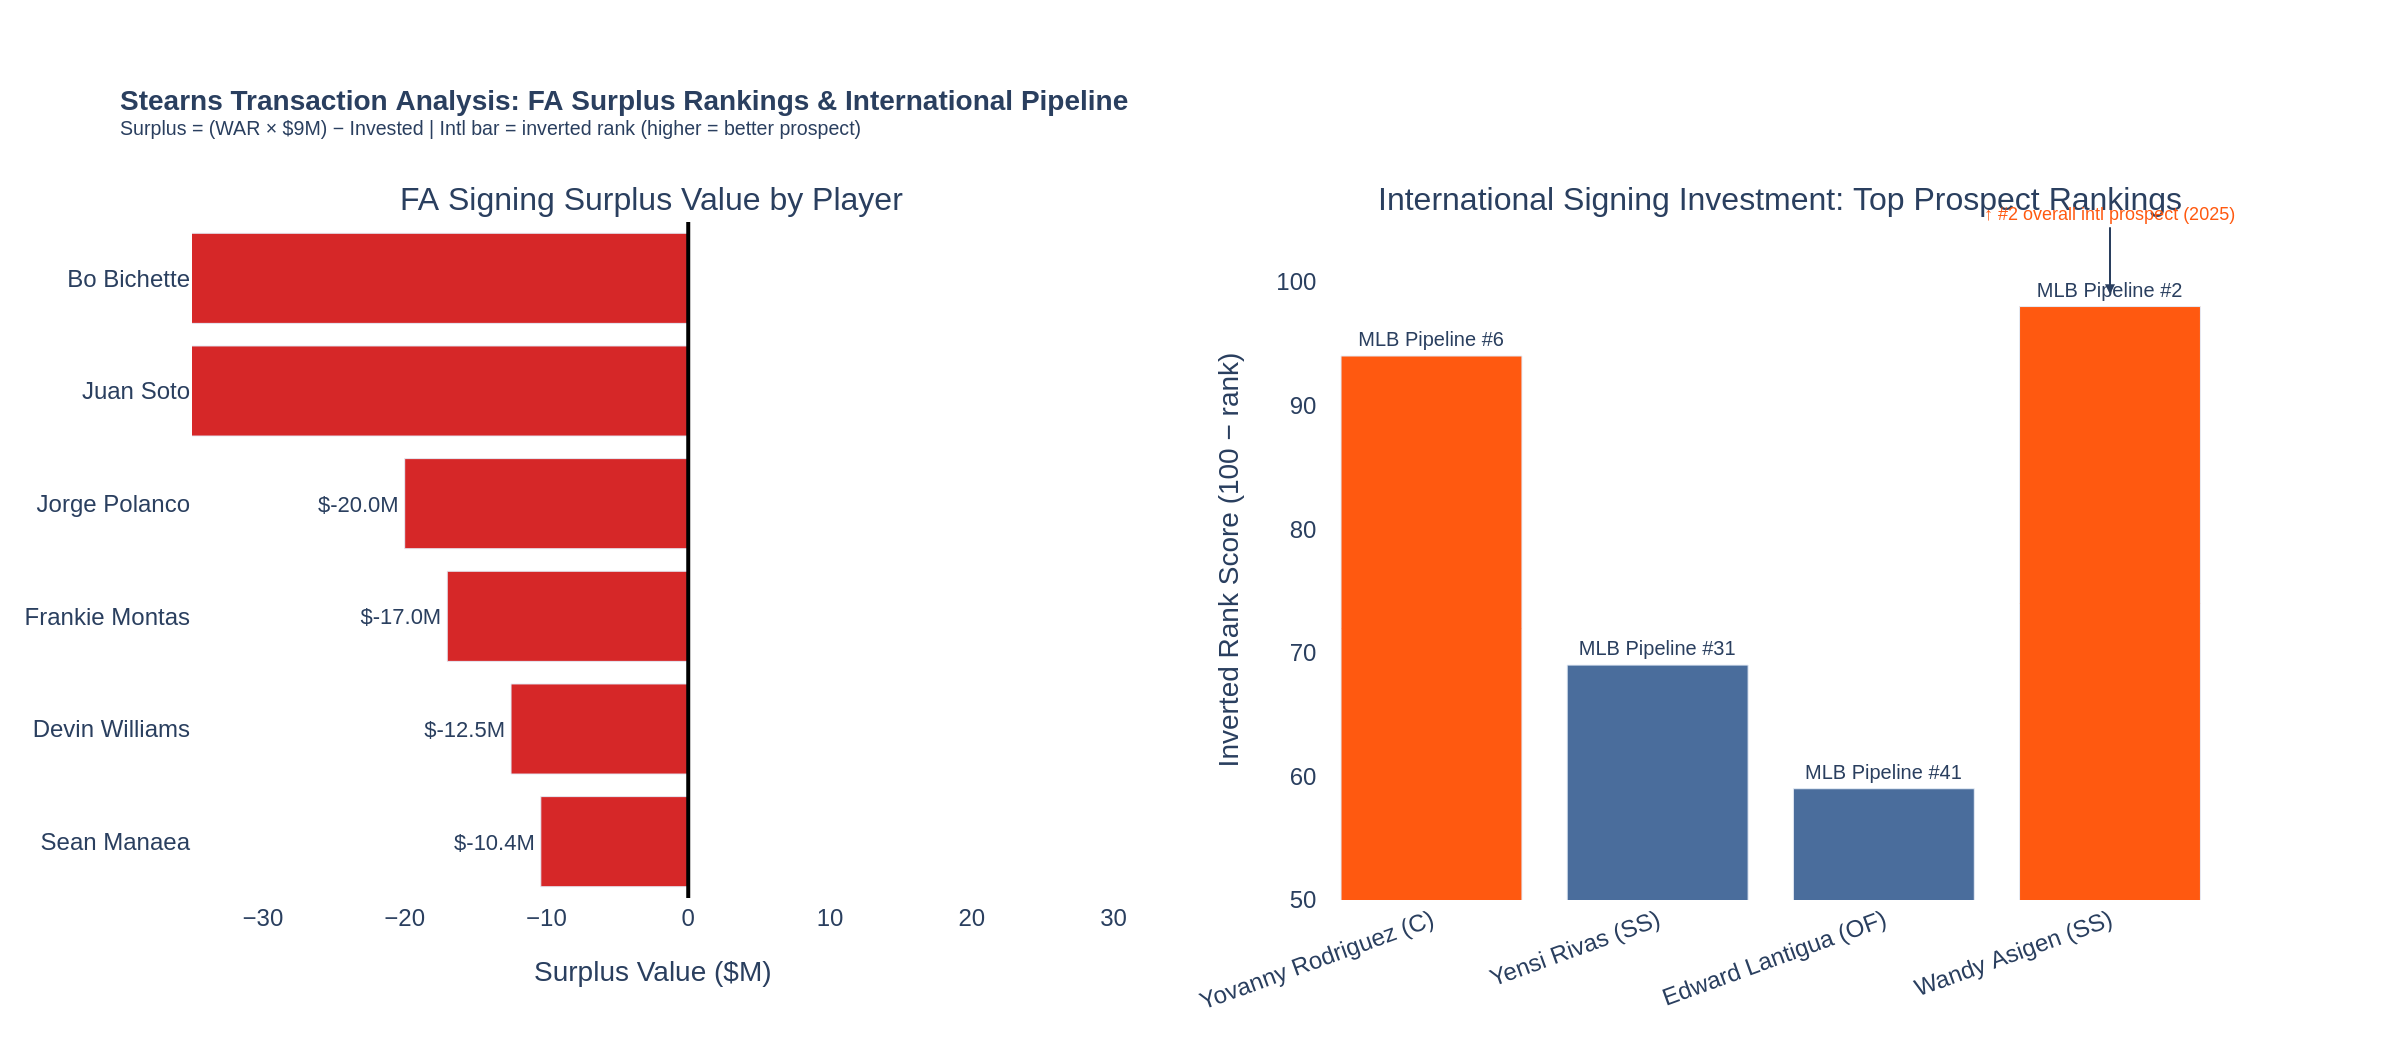
Stearns' free agent ledger reflects the inherent tension in his stated philosophy: build with low-risk, short-term deals — except when a generational talent requires an exception. The exception, predictably, dominates the discussion. The Juan Soto deal at $765 million over 15 years is the largest contract in the history of professional sports. It was justified as the type of irreplaceable opportunity that warrants deviation from low-risk orthodoxy, and Soto's immediate 6.2 WAR performance in 2025 validates the strategy's premise. The analytically honest assessment is that the current negative surplus figure (–$38.1M through two years) is a timing artifact of front-loaded accounting, not a genuine judgment on a 15-year investment from a 27-year-old superstar.
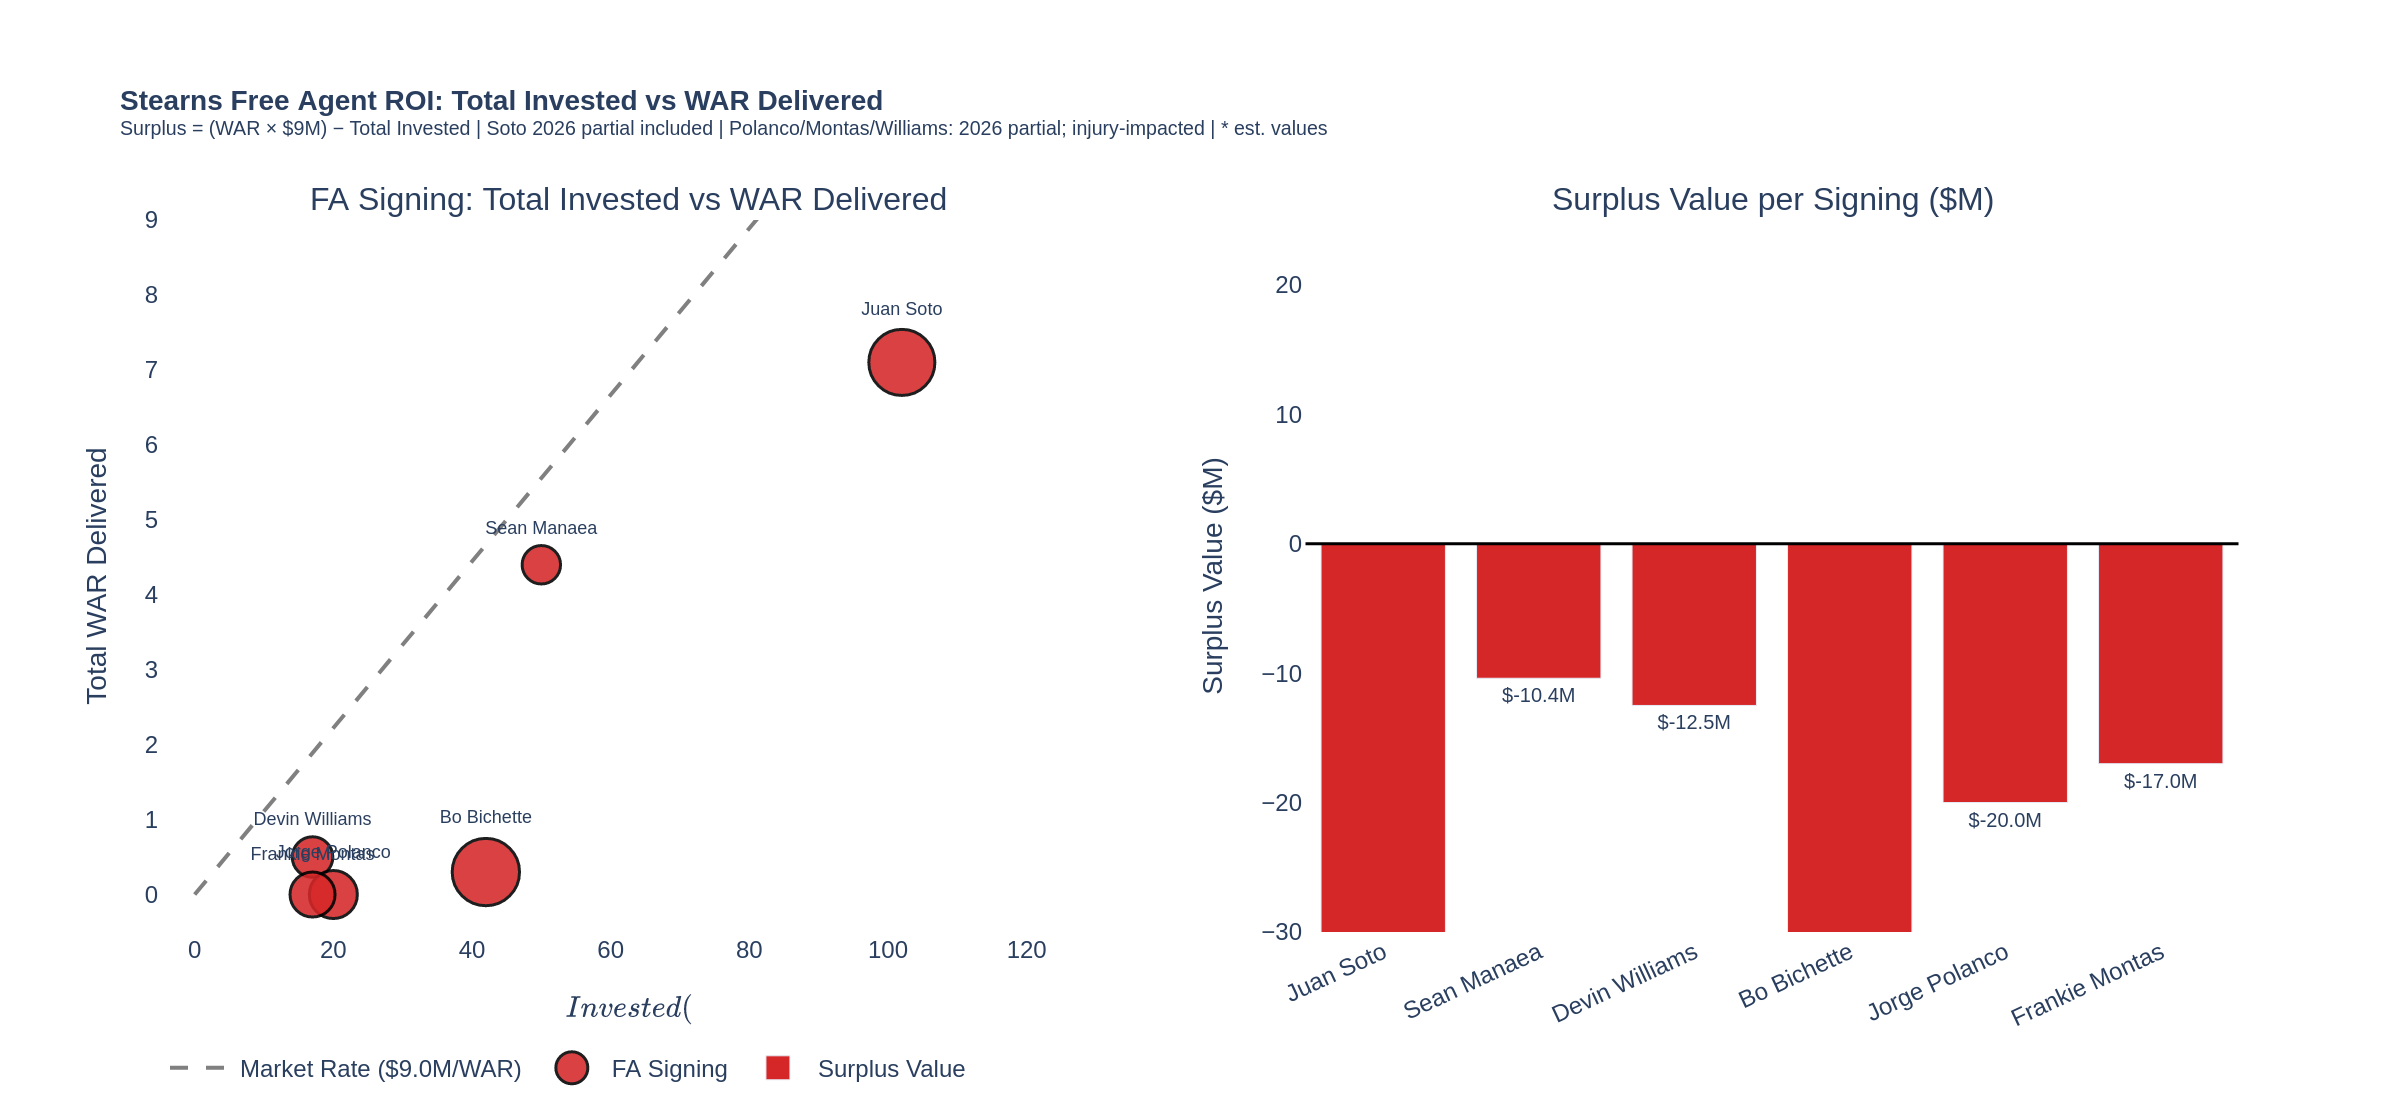
| Player | Contract | AAV ($M) | WAR | Invested ($M) | Surplus ($M) | Grade |
|---|---|---|---|---|---|---|
| Juan Soto | 15yr/$765M | $51.0 | 7.1 (2 yr) | 102.0 | –$38.1 (early) | A* (long-term) |
| Sean Manaea | 3yr/$75M | $25.0 | 4.4 (2 yr) | 50.0 | –$10.4 | B– |
| Devin Williams | 3yr/$51M | $17.0 | 0.5 (partial) | 17.0 (yr1) | –$12.5 | C (early) |
| Bo Bichette | 3yr/$126M | $42.0 | 0.3 (partial) | 42.0 (yr1) | –$39.3 | D (early) |
| Jorge Polanco | 2yr/$40M | $20.0 | 0.0 (IL) | 20.0 (yr1) | –$20.0 | F (yr1; injured) |
| Frankie Montas | 2yr/$34M | $17.0 | 0.0 (IL) | 17.0 (yr1) | –$17.0 | F (yr1; IL — lat) |
Table 5 — Stearns free agent signing ROI. Surplus Value = (WAR × $9M) – Invested. *Soto graded A* — long-term surplus value highly positive if he sustains 4+ WAR/year; current negative is a front-loaded accounting artifact. Market rate: $9M/WAR.
The 2026 free agent cluster — Bichette, Polanco, Montas — is where Stearns' high-risk philosophy has been most exposed. All three were acquired based on upside potential that their injury histories and recent performance declines made uncertain. All three have either underperformed or been injured in year one. The total projected cost of these three signings alone exceeds $200 million over their full contract terms. Even granting that partial-season evaluations are inherently unfair, the simultaneous realization of correlated risks — the defining structural fragility pattern we also observed in Boston — is a roster construction failure, not a manager execution failure.
Payroll Efficiency: The Most Expensive Wins in Baseball
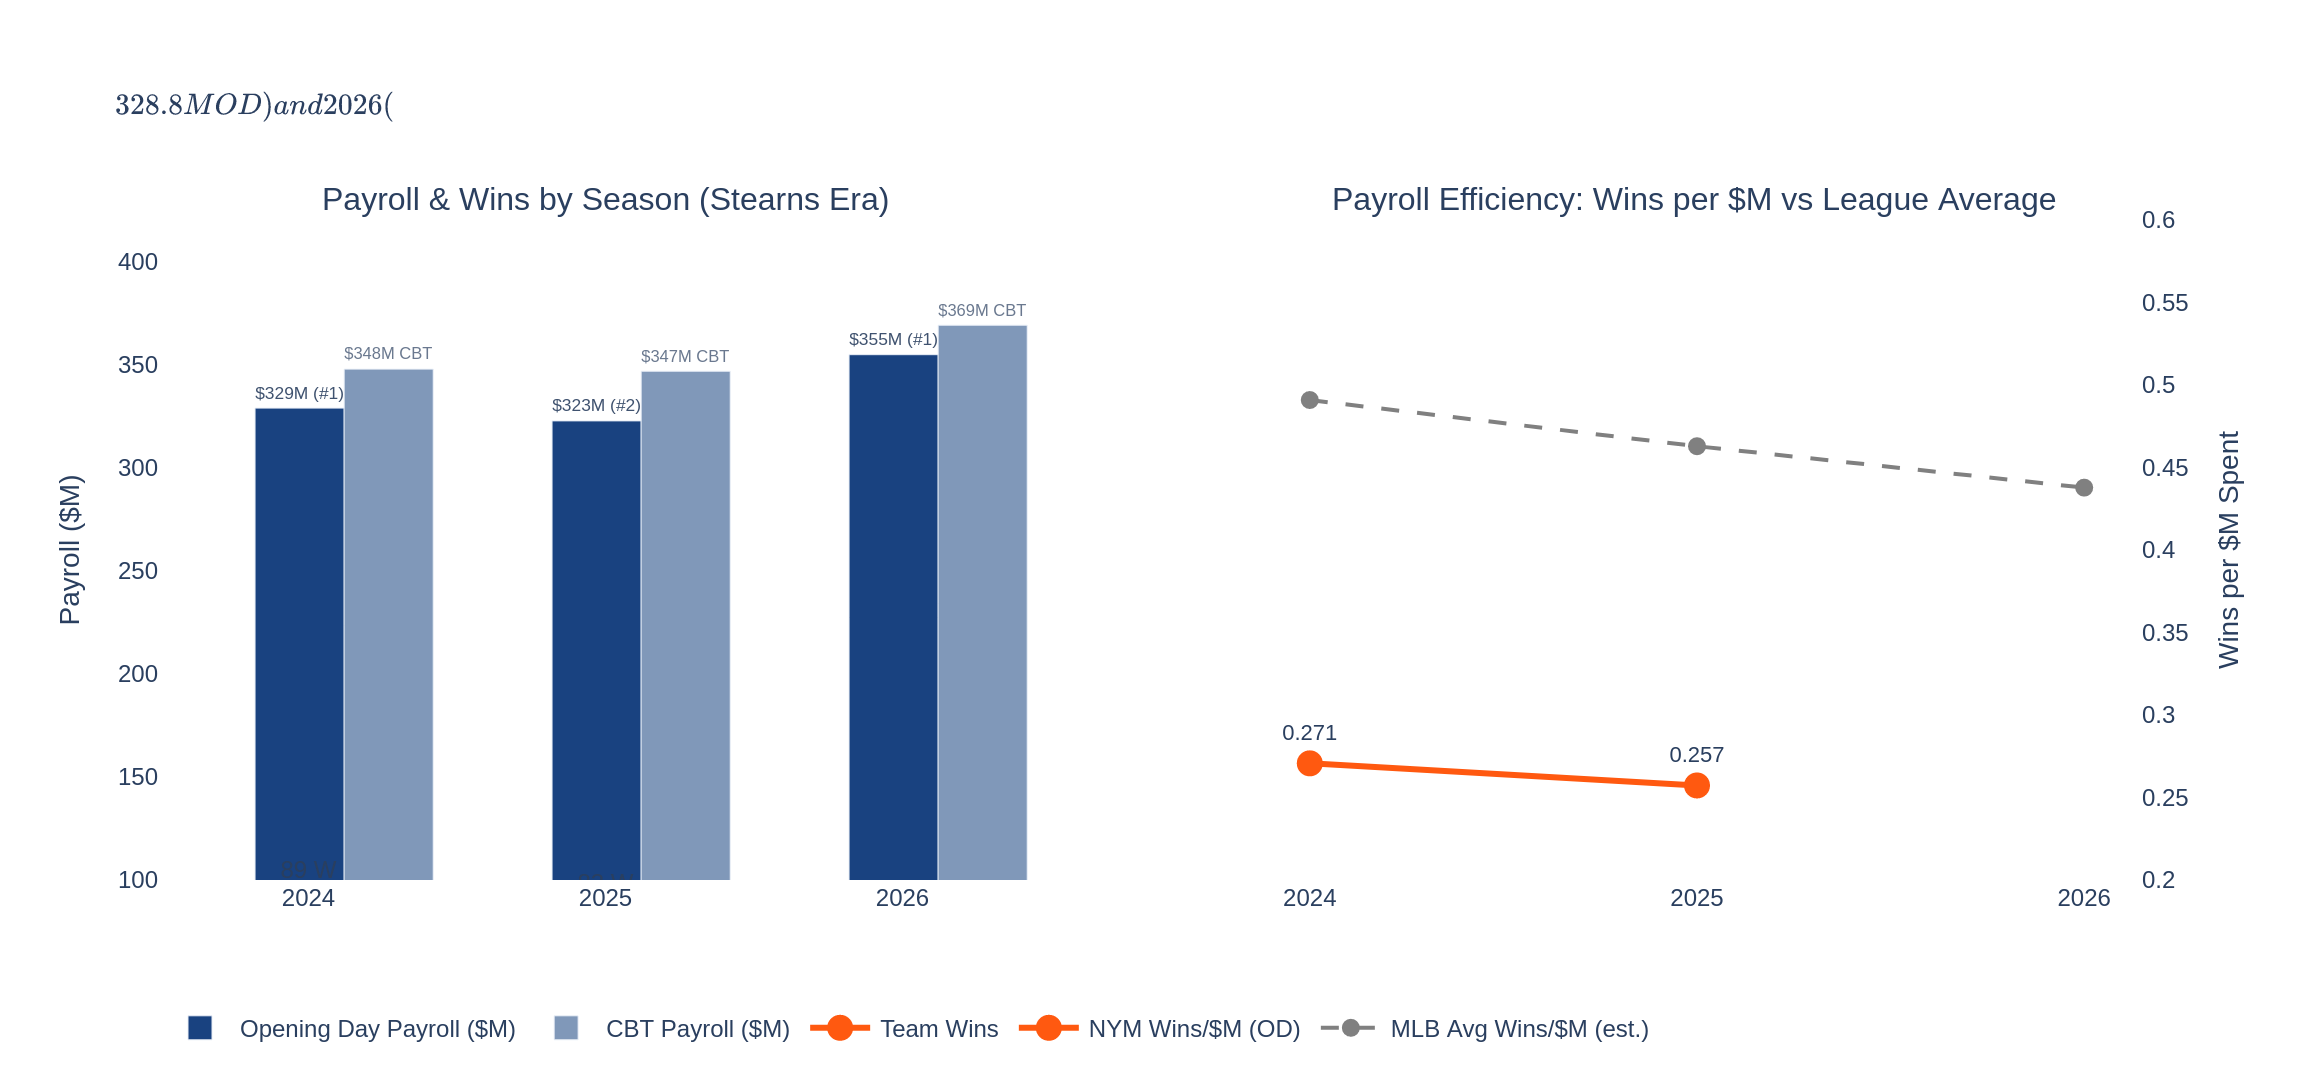
| Season | OD Payroll ($M) | CBT ($M) | Wins | Wins/$M | MLB Avg Wins/$M | NYM vs Avg | MLB Rank |
|---|---|---|---|---|---|---|---|
| 2024 | $328.8M | $347.7M | 89 | 0.271 | ~0.491 | –45% | #1 (highest) |
| 2025 | $322.6M | $346.7M | 83 | 0.257 | ~0.463 | –44% | #2 |
| 2026† | $354.7M | ~$369M | 11–21† | — | — | — | #1 (highest) |
Table 6 — Mets payroll efficiency vs. estimated MLB league average. †2026 partial season through May 1. The Mets purchase wins at roughly 3.5–4× the cost of an average MLB team — the widest such gap in the three-franchise analysis presented in this series.
The efficiency gap is striking: at $328.8 million for 89 wins in 2024, the Mets spent approximately $3.7 million per win versus an MLB average of roughly $2.0 million. Some of this is structural to high-payroll teams — buying above-average wins is the explicit design of the strategy, and each incremental win above league average is more expensive than the last. But the gap is wider here than at the other top-three payroll franchises in this series: the Red Sox under Breslow, spending $207 million for 89 wins in 2025, achieved similar win totals at roughly 60% of the Mets' cost. The comparison is not perfectly apples-to-apples — roster ages, contract structures, and market positioning differ — but the efficiency gap is wide enough to merit scrutiny on top of the structural premium one would expect.
Draft and International Pipeline: The Hidden Strength
The area where Stearns has most clearly outperformed his immediate on-field results is in player acquisition and pipeline development. His international signing record is exceptional by any standard. In the 2024 international class, the Mets signed three top-50 prospects simultaneously: Yovanny Rodriguez (#6 overall), Yensi Rivas (#31), and Edward Lantigua (#41). In the 2025 class, they secured Wandy Asigen — the #2 overall international prospect on MLB Pipeline's rankings. These are franchise-building acquisitions that will not be visible in a win-loss column until 2028–2030 at the earliest, but they represent exactly the type of deep organizational investment that sustained winning requires.
The draft record under Stearns has been complicated by luxury tax penalties — the Mets' persistent residence in the third CBT tier pushed their 2025 first-round pick back to #38, a significant penalty. Despite that constraint and the second-smallest bonus pool in baseball at $5.47 million, the front office still signed 18 of 19 picks, going over their allotment to secure high-upside talent in later rounds. This speaks to an organizational capability that transcends pure financial muscle — the ability to convince prospects to sign below their market value based on the organization's pitch and development reputation.
Part III: The Verdict
The Evidence in Full
The central question of this article — who bears primary responsibility for the Mets' situation as of May 2026 — is analytically clearer in New York than it was in Philadelphia or Boston, for one specific reason: unlike Rob Thomson and Alex Cora, Carlos Mendoza has not been fired. His employer has publicly stated that the team's widespread struggles do not constitute a "manager problem." That institutional verdict is, in itself, a piece of evidence. Stearns, who constructed the roster, is essentially directing accountability inward — toward his own decisions — rather than outward toward the field staff.
The data largely supports that framing. Mendoza's 2024 performance — engineering an 11.5-game-below-.500 rescue mission, sustaining a .626 pace for the final 107 games, and guiding the team to within two wins of the World Series — is the most analytically impressive managerial achievement among the three managers examined in this series. His 2025 collapse was severe, but it occurred with a team posting a positive run differential (+51 runs) that should have produced 86 wins; the –3 Pythagorean gap reflects underperformance in close games that is partly tactical but primarily a personnel question. The 2026 early struggles reflect a team with a –34 run differential — a genuine performance failure, not merely bad luck in close games, and one that cannot be meaningfully attributed to lineup construction decisions when the starting rotation and multiple offensive signings are simultaneously injured or struggling.
The Structural Fragility Pattern — Repeated
What is striking about the Mets' 2026 collapse is how closely it mirrors the structural failures observed in Philadelphia and Boston. In all three cases, the precipitating factor was not a managerial failure but a concentration of correlated risks in roster construction that materialized simultaneously. The Phillies lost Zack Wheeler to TOS, saw Aaron Nola's velocity decline, and watched the entire projected bullpen underperform. The Red Sox lost five starting pitchers to simultaneous injuries. The Mets saw their injury-history acquisitions (Robert Jr., Polanco, Montas) all break down together, while their high-profile infield signing (Bichette) struggled at the plate.
In every case, the manager absorbed institutional scrutiny. In two cases (Thomson, Cora), the manager was fired. In the Mets' case, Stearns has explicitly declined to redirect accountability toward Mendoza. This is either genuine organizational integrity or a recognition that the accountability trajectory, if followed honestly, leads to the architect's office rather than the dugout.
The Philosophy Stearns Abandoned
The most analytically interesting question about Stearns' Mets tenure is not whether his Milwaukee philosophy translates to New York — it is whether he has remained committed to that philosophy at all. His Milwaukee approach was built on three principles: avoid long-term commitments, prioritize roster flexibility, and pay for performance rather than reputation. The 2024 Mets season was a clean expression of those principles. The 2025 and 2026 rosters are not.
The $765M, 15-year Juan Soto contract is the largest commitment in the history of the sport. It will pay Soto through age 41 — exactly the kind of aging-curve risk Stearns built his reputation by avoiding. The $126M Bichette signing committed long-term dollars to a player with documented injury history and unproven pressure-environment performance, in a market notorious for amplifying both. The Polanco and Montas signings were short-term, but the underlying logic — paying for past performance from declining-velocity, injury-history players — was a clear deviation from his stated approach.
The honest framing is not that Cohen's resources strained Stearns' philosophy. It is that Stearns chose to spend Cohen's resources in ways his philosophy would have rejected in Milwaukee. The 2024 success made the deviation feel earned; the 2026 collapse has made it look like a regression to the mean of how big-market GMs typically fail. The Soto contract may yet age into legend if Soto sustains his elite production into his late thirties, but the $50M+ AAV commitment alone represents a portfolio risk Stearns would never have countenanced two years ago. The question for the next two seasons is whether the architect who built Milwaukee's value engine is still operating, or whether the New York context has produced a different executive than the one whose reputation justified the hire.
Looking Forward
The Mets' competitive outlook hinges on two recoveries: the health and performance of the 2026 acquisitions, and whether Soto can sustain his elite production as the franchise cornerstone for the duration of his contract. The international pipeline — Asigen (#2 overall), Rodriguez (#6), Rivas (#31), Lantigua (#41) — will mature into organizational depth around 2028–2030, potentially arriving precisely when the current core's contracts begin to age. The draft class development, even with pick penalties, continues to build toward a farm system that could support roster flexibility in the medium term.
What is analytically clear today: Carlos Mendoza is managing a roster whose failures are primarily attributable to the front office's roster decisions, not to his tactical choices. David Stearns built an excellent 2024 team and has shown genuine talent-evaluation skill in the trade market and international pipeline. But the 2026 version of the Mets — whose $354 million payroll is producing an 11–21 record — reflects strategic risks that were identifiable before the season began and that the manager had no authority to prevent. Mendoza didn't sign Robert Jr. Mendoza didn't trade Nimmo for Semien. Mendoza didn't commit $126 million to a shortstop who would struggle in New York's market pressure. He is left managing the consequences of those decisions while the architect retains full authority — and, for now at least, retains the public support of his employer as well. Whether that support survives a second consecutive collapse — and whether Stearns himself can return to the philosophical discipline that built his reputation — will define the next phase of this analytically rich, commercially expensive franchise.
Bottom Line: Carlos Mendoza is an analytically solid, still-developing manager whose tenure has featured the most dramatic performance swings in franchise history — in both directions. David Stearns is a genuinely skilled executive whose 2024 work was superb and whose long-term organizational investments are sound, but who constructed a 2026 roster with concentrated, correlated risk that has collapsed with brutal predictability. The decision to publicly retain Mendoza while owning the NL's worst record reads as intellectual honesty about where the accountability actually lies. The data agrees: a $354 million team playing .344 baseball is a roster-construction failure first, a managerial failure a distant second, and the architect deserves the larger share of scrutiny.
All statistical data sourced from Baseball-Reference, FanGraphs, MLB.com, and contemporaneous reporting through May 1, 2026. WAR market rate of $9.0M per 1.0 WAR used for surplus value calculations. Pythagorean win projections calculated from confirmed RS/RA data using the formula RS²/(RS²+RA²) × 162. WAR values marked with asterisk (*) are estimates derived from qualitative report descriptions. Surplus values for multi-year contracts reflect total invested vs. WAR delivered to date — long-term contracts (especially Soto, 15yr) should not be judged on partial-period accounting. We invite informed disagreement: methodology, data, and editorial judgment can all be challenged via the contact form at /contact, and corrections are issued where warranted.